How to Determine Near Term Market Support
 In my previous post How to get your Minions working for you – Part 2 I discussed a ‘Buy on Dips’ strategy were you would consider to purchase one of our high quality dividend growth stocks when the market is within 20% of the near term market low (the dip). Just how do you determine when the market has dipped?
Here’s how you do it. It’s pretty simple really.
1. Take a one year chart of the DJIA index (I use the Diamonds DIA ETF for reasons I’ll explain later) and draw a line across the recent high points and another line across the low points and create a channel that the market has moved in. “Near term” means the most recent 6 month channel trend give or take a month. You can usually get 3 high and 3 low points that line up (it’s quite amazing really). The more touches in the channel the stronger the trend. See the chart below (Dec 5, 2013) and notice that both the resistance (highs) and support lines (lows) each have 3 spots were the chart touches the lines.
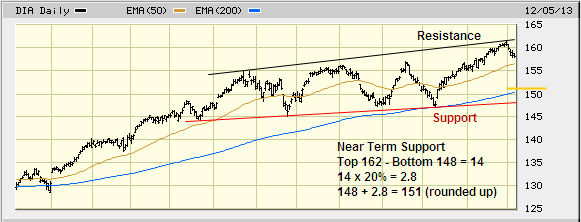
2. On the right edge of the chart (today) determine what price the lines are at. In this case the high is 162 and the low is 148.
3. Next you run the formula displayed at the bottom of the chart to determine what is 20% above the support line (bottom of channel). In this case it’s 151 as indicated by the orange marker line on the edge of the chart.
When the market drops at or below 151 we are in the near term dip zone. Why don’t we use 148 the bottom of the channel? Because ther are many times when the market does not pull back all the way to the support trend line, in which case you would miss the dip. This allows some buffer to catch a higher percentage of the dips for buying opportunities. For example, notice in early Sept there was a dip that didn’t touch the support line, but it was within 20% of the line.
Now you need a way to be notified when the market enters this dip range. I use the Diamonds (DIA) fund because it can be entered into the Dividend Geek ‘Watch List Alert’ tool so you can receive an email notification when the DIA moves below 151. The DIA is a type of mutual fund that mirrors the DJIA (Dow). The Dow is the most well known U.S. stock index comprised of the 30 largest U.S. companies. I use the Dow instead of the S&P 500 index because most dividend growths stocks are large cap making the Dow is a better match.
Dividend Geek members can set this up in two easy steps
1) Go to your ‘Update Your Income Machine’ portfolio page and add “DIA” into the symbol field at the bottom of the page. Click ‘Save’ button.

2) Go to your ‘Setup Watch List Alerts’ page and enter 151.00 in the “Price Falls To” field. Again click the ‘Save’ button at the bottom of the page to capture your entry.

Now you not only know how to determine when the market dips, but can be automatically notified when the market pulls back into this potential buying opportunity range. Doing so will both increase your margin of safety (better value) and increase your initial dividend yield (more income). Win/Win!
As always I’m available to help. Feel free to contact me if you have any questions at blaine@dividendgeek.com
All the best,
Filed in: Dividend Growth Investing • Website Tools
Subscribe
If you enjoyed this article, subscribe to receive more just like it.


