Your Investment Survival Tool
In the old west your daily survival literally depended on the reliability and power of your most closely held tool – your rifle. In 1873 a new popular rifle was produced. Buffalo Bill called it “The Boss” but Winchester called it, simply, the new model of 1873.

Image Credit: Rianovosti
The “Winchester 73” was born. Its lever action that came to symbolize the American frontier had two timeless features: reliability and sheer firepower. It was a raging success, and so popular that it remained in production for 52 years. It became known as “The gun that won the West.” Even telegraph operators started to sign off their Morse Code transmissions with “73” short for best regards my good friend (they were a really good friend), that tradition continues even today as Ham Radio operators sign off their transmission saying “73′”.
Likewise, your financial investment survival may very well depend on the reliability and power of what should be your primary tool – a portfolio tracker. One that meets the needs of your investment methodology and objectives. As you use and maintain it daily your portfolio tracker will become your good friend.
I have tried and used many portfolio tracking tools over many years of investing. However, once I discovered dividend growth investing (about 10 years ago) I couldn’t find a tracker focused on income and dividend growth investing metrics, so I built my own! The nice thing about spreadsheets is that you can customize them to suit your needs and that’s just what I did. Through the years I have made many revisions and improvements. Currently I use Google Sheets to utilize Google’s real time financial data formulas.
Here are some of the dividend growth investing metrics my portfolio tracker tool can do that are not found in traditional portfolio tools:
- Investment Rate (percentage of your earned income that you contribute to investments)
- Annual Income
- Yield on Cost
- 3-Year Average Dividend Growth Rate
- Estimated date you’ll reach your Crossover Point (when your income meets your expenses)
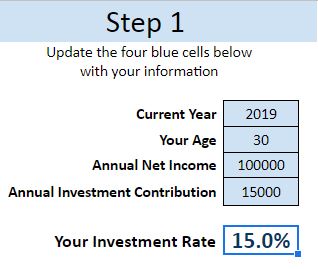
Investment Rate
This is applicable to all styles of retirement savings, but probably under utilized by most investors. It is simply the percentage of your net income that you contribute to investing.
The formula is: Annual amount of investment contribution / net income = % investment rate.
For example, if you contribute $15K annually and your net income is $100K then your investment rate is 15%. Here’s what it looks like in the portfolio tracker spreadsheet. Personally I include my goals and actual investment rate numbers on my spreadsheet.
Annual Income
The bottom of portfolio lists the total annual income. This is the total annual amount of money currently generated by the dividend payments from your individual holdings. This is another metric that I like to track each year to guage my progress.

Yield on Cost
Yield on Cost (YOC) is your dividend yield based on the cost you paid for your stock and the current dividend payment. The formula is:
Dividend Payment / Stock Cost Basis = Yield on Cost
YOC is more of a performance metric on how well you purchase quality stocks below fair value and how well the company increases its dividend (Dividend Growth Rate) after you have made your purchase. Over time your YOC will increase as the companies you invested in raise their dividend each year. Also, when you lower your cost basis by adding new shares to an existing position at a lower price.
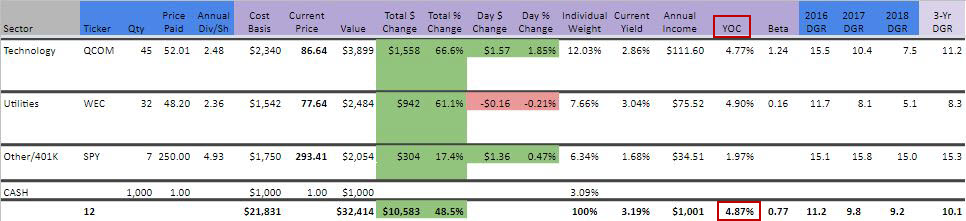
3-Year Average Dividend Growth Rate
This metric is a good gauge of recent dividend growth rate performance. I like my portfolio to average between 8% to 10% 3-year dividend growth rate. All column headings highlighted in blue require manual data entry. So you will need to enter the dividend growth rates for the past 3 years to get the average. It is worth the effort as it also shows you how each company’s DGR is trending. The best way to find yearly dividend growth rates is to download David Fish’s Dividend Champions, Contenders, and Challengers Excel spreadsheet, from the ‘Drip Investing Resource Center‘ go to the ‘Historical’ tab and look up your stock in the ‘Percentage Increase by Year’ section (data for 2018 -2016 are in columns Z, AA, AB). This spreadsheet has a lot of great information and is one of my primary resources.
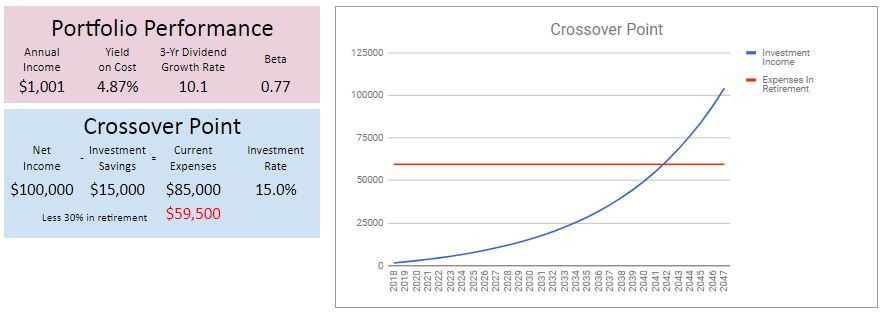
Crossover Point
Once you enter your data in the ‘Step 1’ tab and updated your portfolio information in the ‘Step 2′ tab the Dashboard will calculate a basic estimate for the year your investment income meets your retirement expenses. Note that the ’30 Year Portfolio Projection’ is based on a snaphot of your current investing status, which will evolve and change over time. Your dividend yield, growth rate, the amount of money you contribute to your investment portfolio and the rate dividends are reinvested all factor into dividend income generated in retirement.
Download the Dividend Geek Portfolio Tracker Spreadsheet!
You can download the portfolio tracker spreadsheet file from the Downloads page. Follow the instructions to import the file into Google Sheets. Notice that there is generic information to illustrate the use of the spreadsheet. Be sure to overwrite this information with your investor profile and portfolio information to make the spreadsheet your own powerful investment survival tool.
73,
Filed in: Dividend Growth Investing • Investment Principles
Subscribe
If you enjoyed this article, subscribe to receive more just like it.


